Introduction
Most reviewers measure the third order intermodulation performance (IMP) performance of a transmitter at full output, which is usually about 100W. I have often wondered how the transmitters perform at lower power levels. This information is never stated.
I sometimes hear on the amateur bands that a transmitter backed off to say 60 Watts generates lower IMPs than a transmitter used at 100 Watts. Yet conversely, I hear others stating the opposite claiming that the manufacturers optimise modern rigs for 100 Watts.
Intuition tells me the former is true. However, in truth I had no idea so I decided to measure a typical SSB solid state rig and find out. In this investigation, the sample size is 1, the transmitter is an FT1000MP and the band is 160m only.
Measurement Results
I measured the IMDs at 5, 10, 30, 59 and 100 Watts PEP on 160 m using a RIGOL DSA815 spectrum analyser. Please don’t ask me why I used 59 Watts and not 60! A RIGOL DS2072 oscilloscope recorded the peak voltage waveform on the dummy load. Power control on the FT1000MP is via a front panel drive control that allows fine tuning and the setting of the PEP power at any level.
A website application called “Online Tone Generator”, found at https://www.szynalski.com/tone-generator/ provided the audio source. To make this into a two-tone source, two of these generators were run concurrently on Chrome at different frequencies of 700 Hz and 1900 Hz. The audio output combines and passed through the computer FT8 24-bit interface into the microphone input. I set the microphone gain to 50% and adjusted the audio level on the PC to suit. The two-tone generator seemed very high quality and yet ludicrously simple if the station is already setup for FT8.
Table 1 – Results – FT1000MP
| Frequency (MHz) | power (PEP) | Third (dB) Relative to a Single Tone | Fifth (dB) Relative to a Single Tone | Seventh (dB) Relative to a Single Tone |
|---|---|---|---|---|
| 1.9 | 100 | -35.58 | -45.46 | -43 |
| 1.9 | 59 | -39.24 | -41.6 | -43.2 |
| 1.9 | 30 | -39.63 | -41.09 | -43.3 |
| 1.9 | 10 | -37.95 | -39.43 | -44.3 |
| 1.9 | 5 | -35.46 | -41.33 | -47.7 |
I have to admit to being surprised by the results. The FT1000MP turned out a lot better than I originally thought. The above table shows a summary of the results for the 3rd, 5th and 7th IMPs over the prescribed power range. Result are relative to a single tone. Results relative to PEP will be 6 dB better.
Table 1 suggests that the 3rd order IMPs do indeed improve as the power falls. However, they increase again slightly at low power. The sweet spot is around 30 to 60 Watts. This is exactly what is required and hoped for. It means that the spectral integrity of the FT1000MP is maximised at the ideal level for driving a valve linear. Assuming that the spectral purity of a valve linear is higher than a 100 Watt solid state transmitter, then the combination with backed off drive should provide a good compromise and generate a clean signal.
73 Chris
Plots
The following photos show some of the results. The results for 30 Watts PEP are missing. I should really complete this project by testing on the other bands.
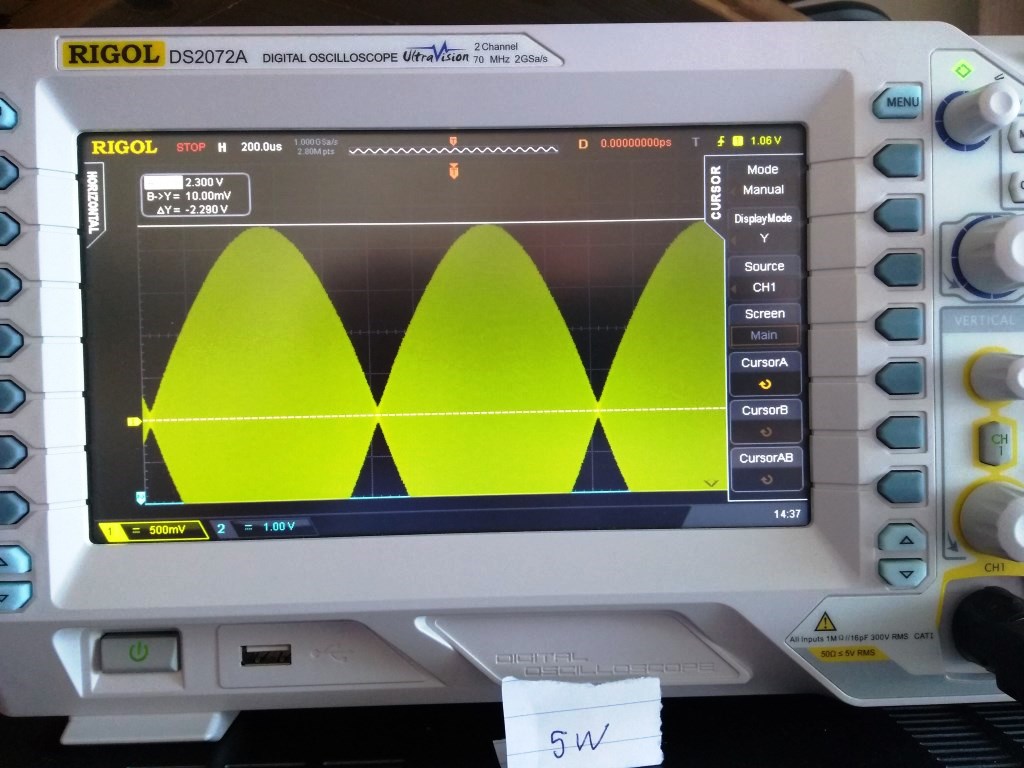
Transmitted time domain waveform – FT1000MP at 5 Watts
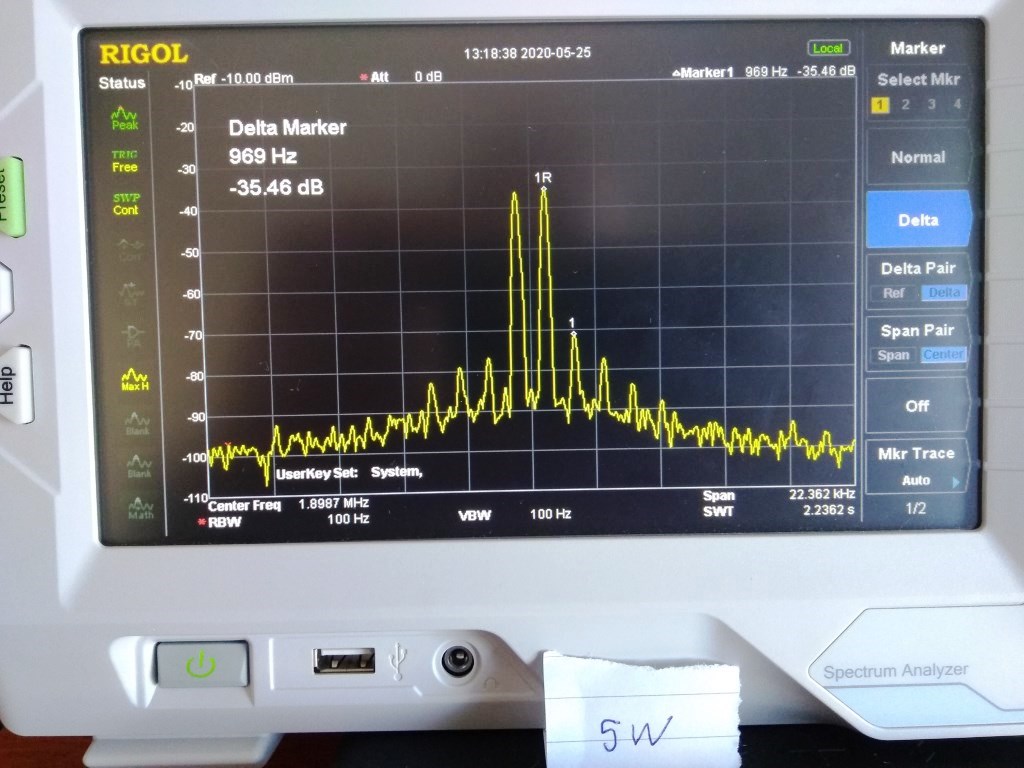
Corresponding frequency scan at 5 Watts
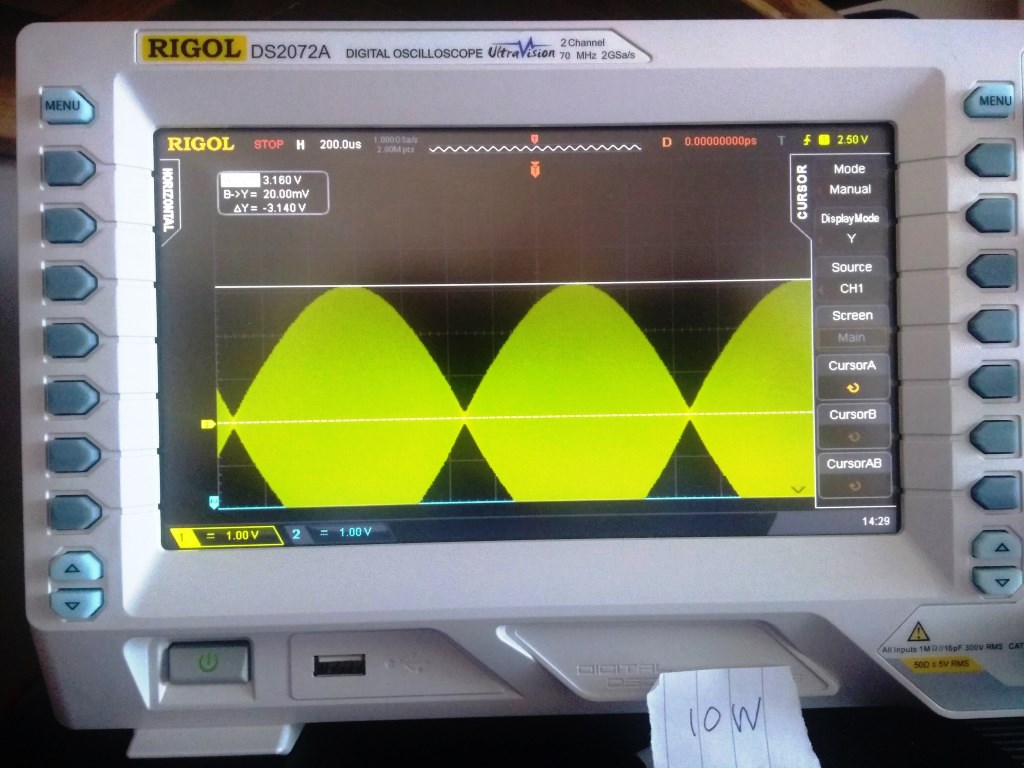
Transmitted time domain waveform – FT1000MP at 10 Watts
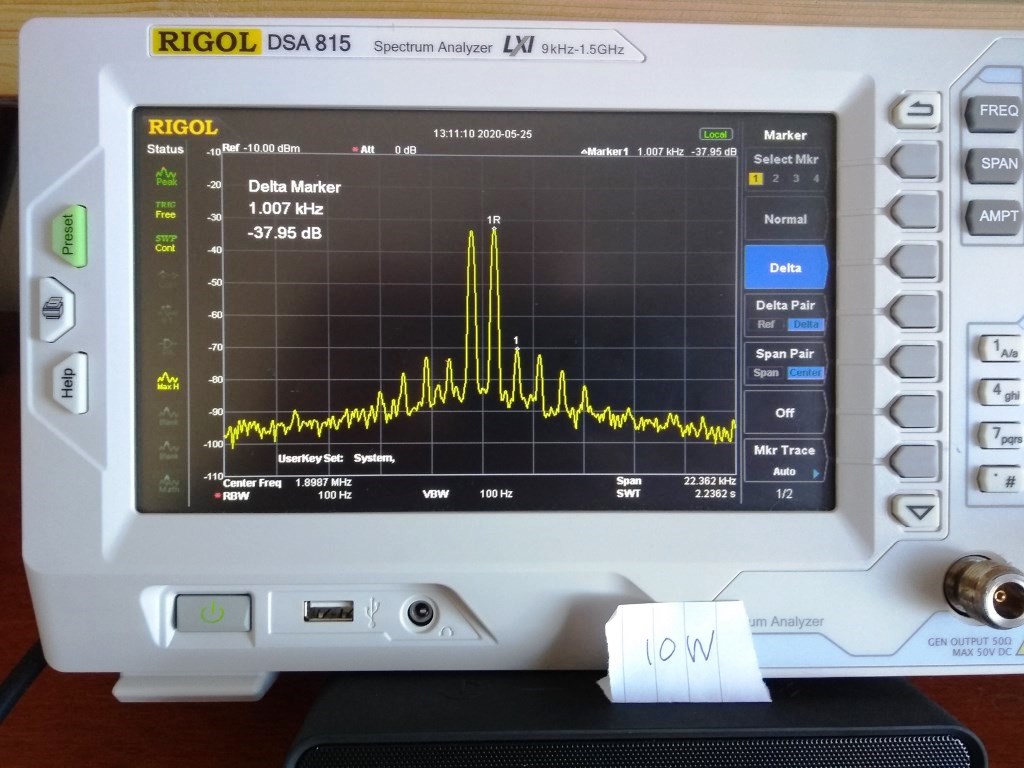
Corresponding frequency scan at 10 Watts
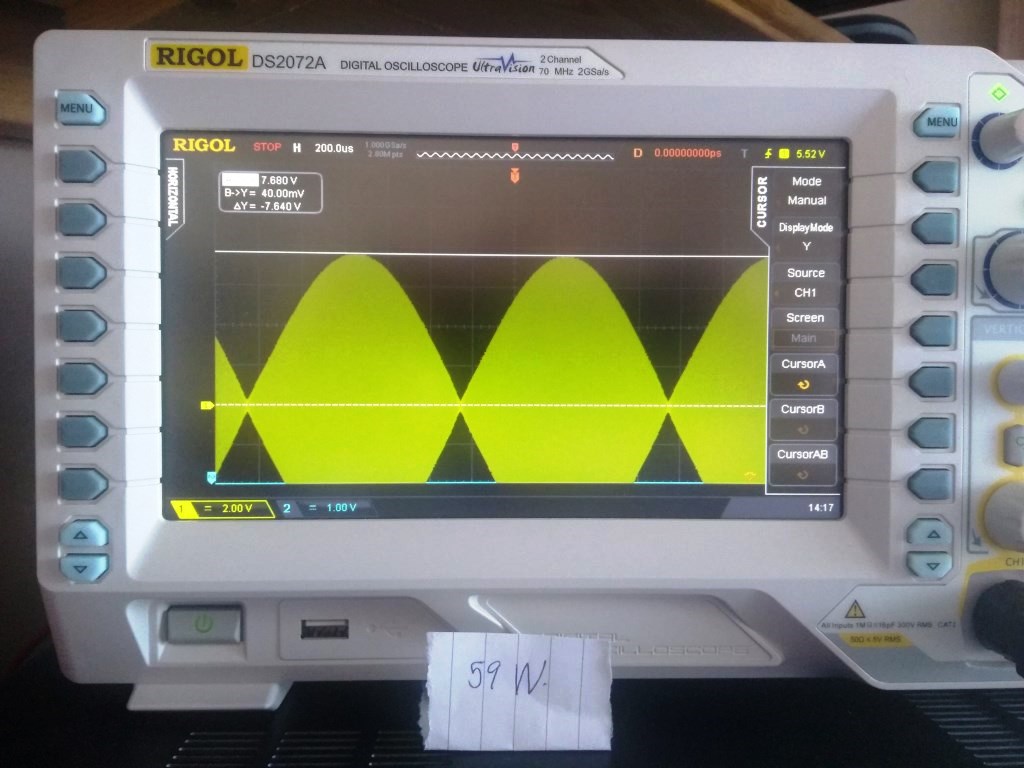
Transmitted time domain waveform – FT1000MP at 59 Watts
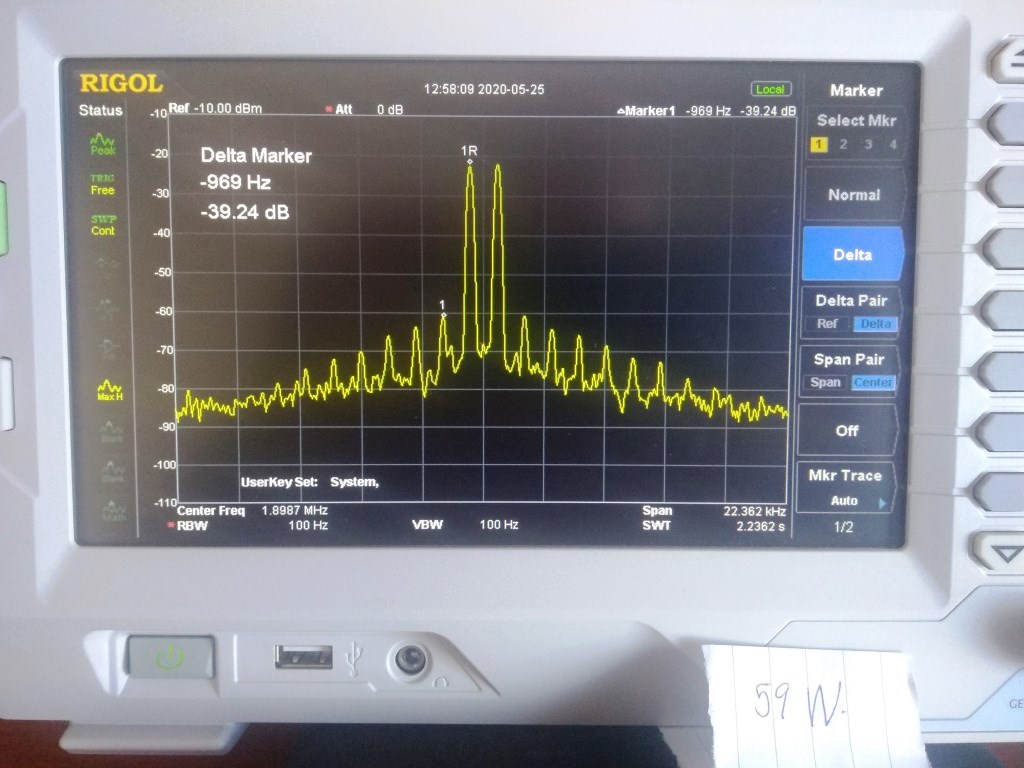
Corresponding frequency scan at 59 Watts
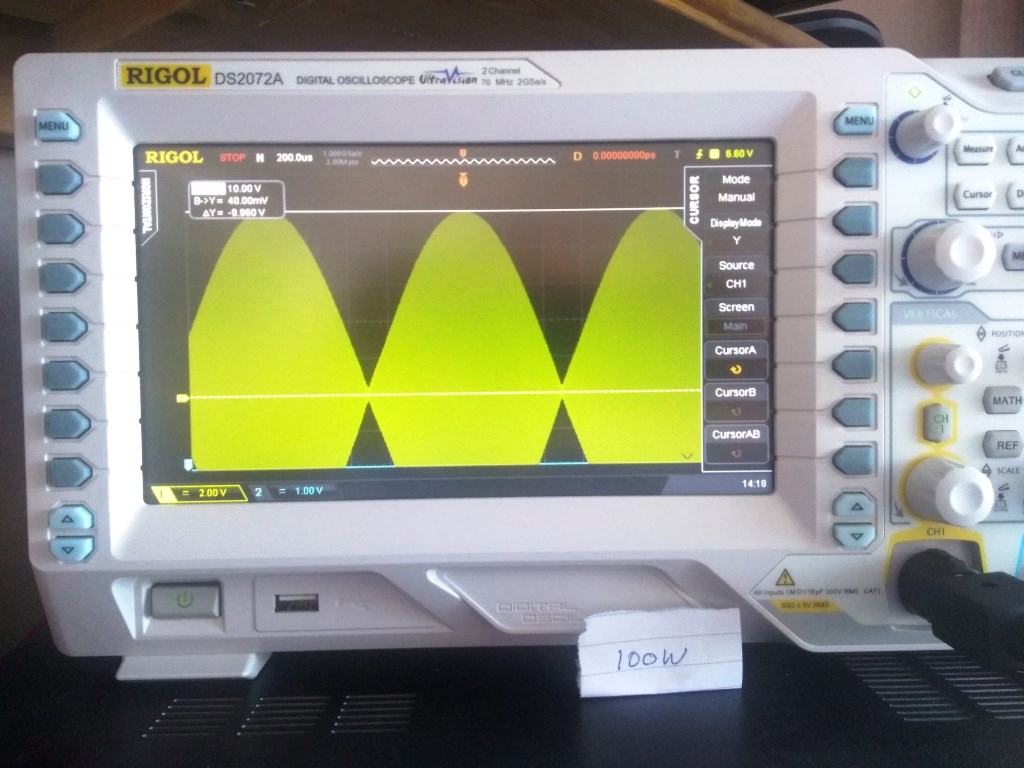
Transmitted time domain waveform – FT1000MP at 100 Watts
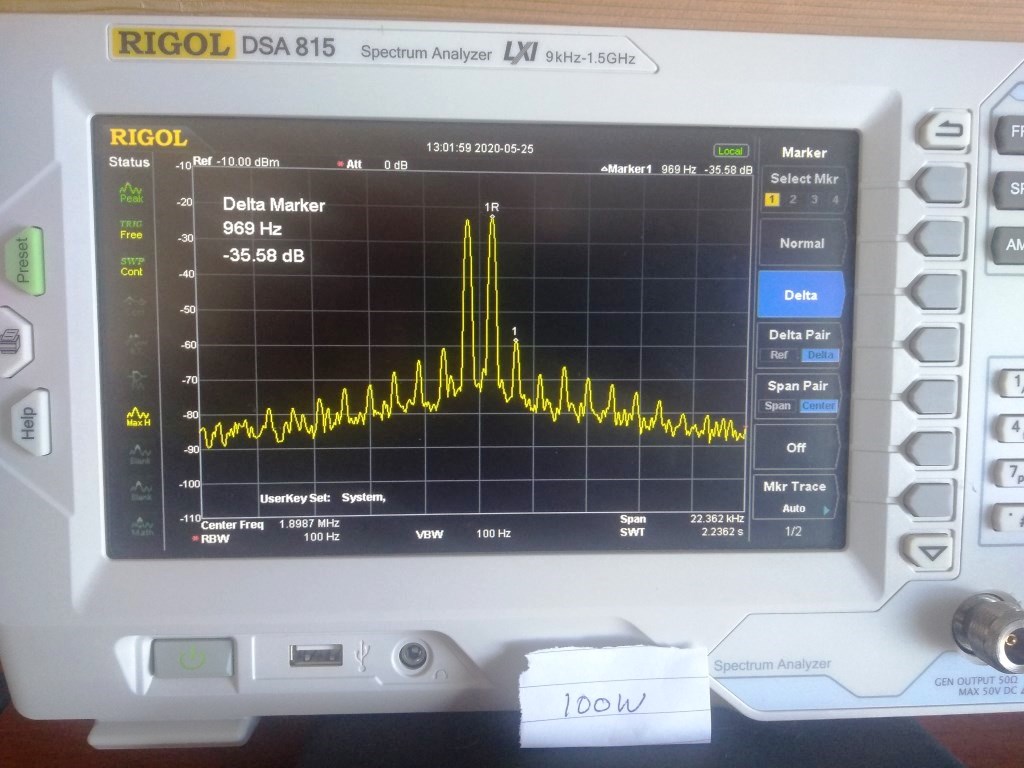
Corresponding frequency scan at 100 Watts